Clean Energy Technology Portfolio
From photovoltaic silicon to fast-response battery systems — explore the six technology pillars that underpin every Energio investment.
Solar PV is the cornerstone of Energio's asset portfolio. Falling module costs, 20-year power purchase agreements, and predictable irradiance data combine to make utility-scale solar the most scalable income-producing clean energy asset class available today.
Energio identifies land with 5+ peak solar hours, secures a grid connection agreement, and confirms no curtailment risk before committing capital.
A 20–25 year power purchase agreement with an investment-grade utility or corporate off-taker locks in fixed-price revenue before a single module is installed.
A fixed-price engineering, procurement and construction contract transfers construction risk to a specialist contractor. Target construction: 6–18 months.
A contracted O&M operator manages performance. Monthly PPA revenues flow through the SPV to investor accounts after priority debt service.
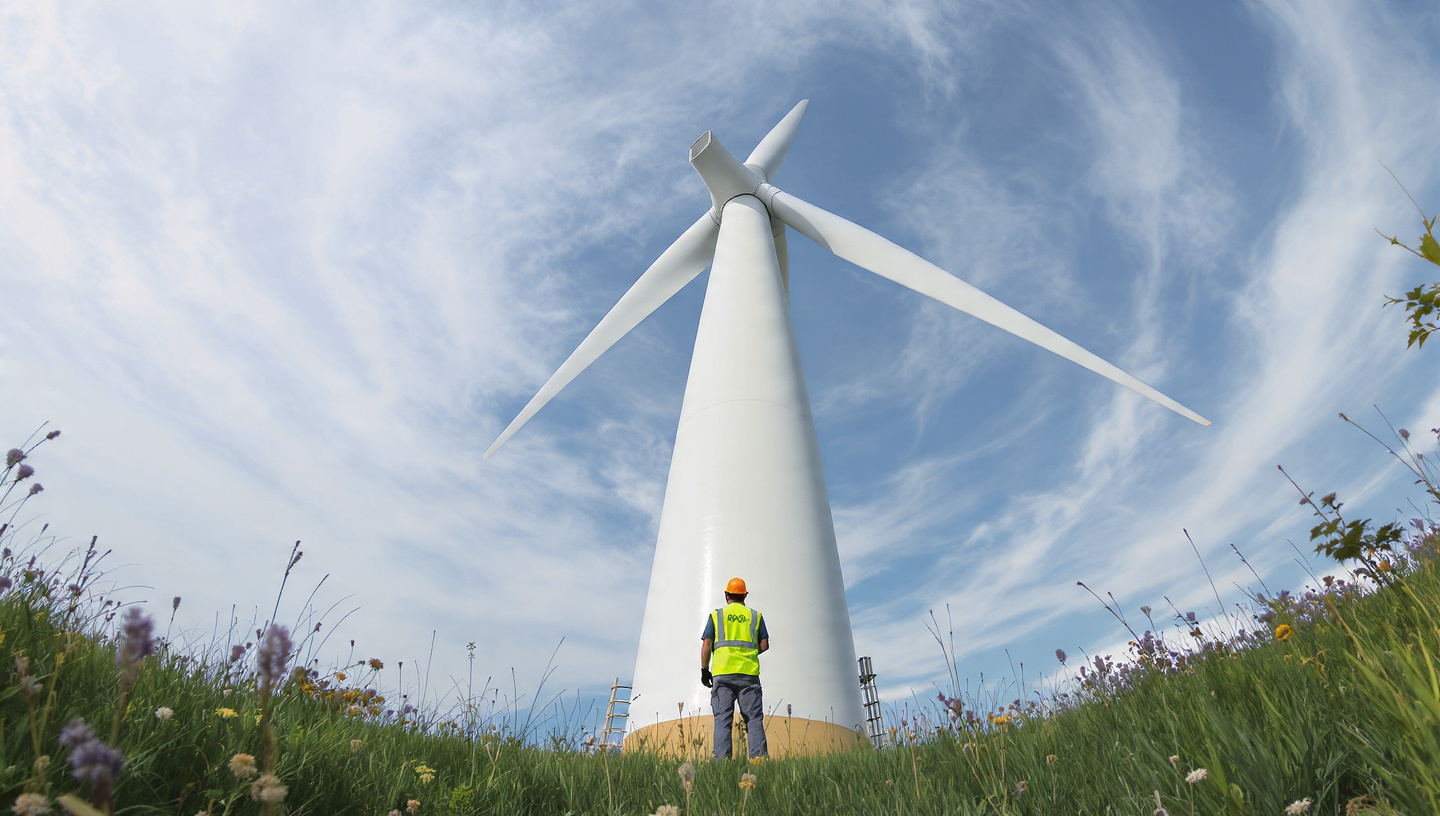
Wind power plants generate predictable, bankable output over a multi-decade project life. Energio selects sites using 10+ years of wind-mast data and independent P50/P90 energy assessments by certified meteorological consultants.

Battery energy storage doesn't just store electricity — it unlocks three independent revenue streams from a single asset, dramatically improving project economics when co-located with solar or wind generation.
Charge at £30/MWh off-peak; discharge at £120–£200/MWh during evening demand peaks. Spread captured as direct operating profit.
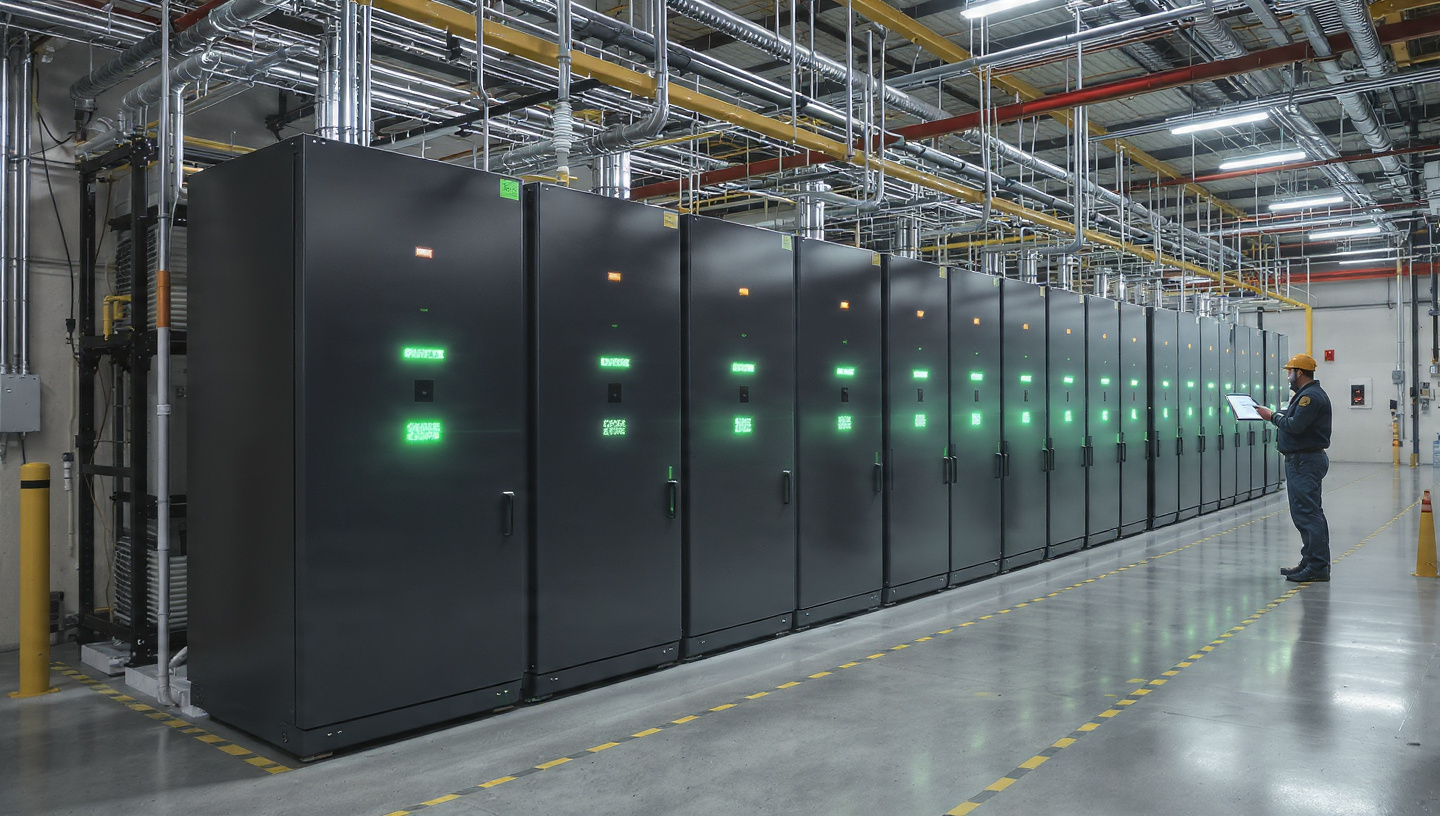
£60–£90/MWh spread (typical UK market)Sub-200ms response to grid frequency deviations earns capacity payments from the transmission system operator, independent of dispatch.
£8–£18/kW/yr (FFR & DC markets)BESS is eligible for capacity market contracts, providing a guaranteed baseline income floor that underpins project debt serviceability.
£15–£35/kW/yr (T-4 auction)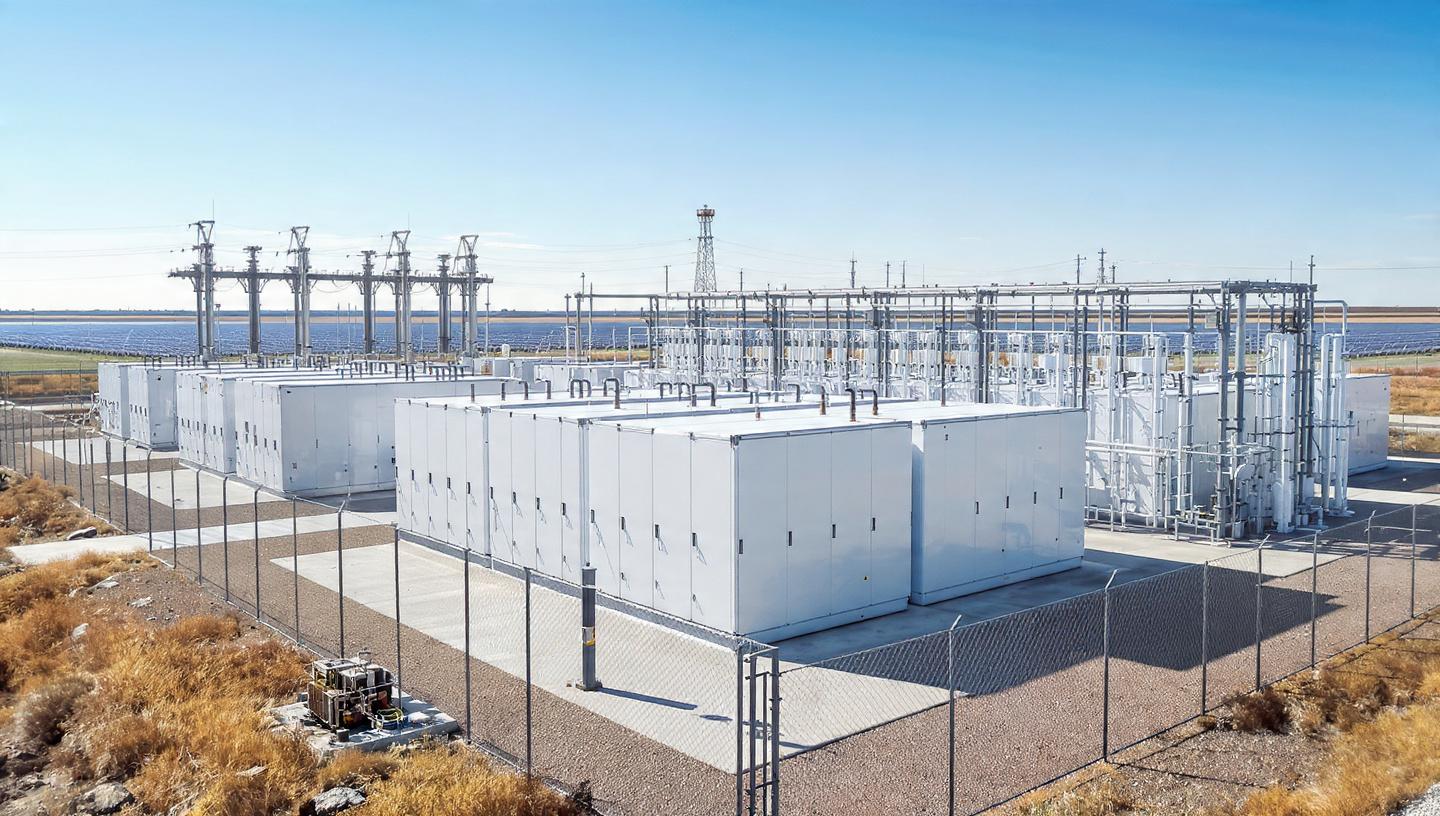
Small-hydro and run-of-river plants deliver the most consistent output of any renewable technology. With virtually no fuel cost and plant lives exceeding 80 years, hydroelectric assets are among the most durable investments in the clean energy universe.
Site permitting, hydrology modelling, civil works. Capital deployed, EPC contract in force.
Senior project finance debt repaid from PPA cash flows. Investor distributions issued quarterly.
All debt retired. Gross operating revenue flows direct to equity investors with minimal opex drag.
Turbine re-power extends asset life at low capital cost. Return on replacement capital is exceptionally high.
Unlike solar and wind, biomass and biogas plants generate power on demand. Sustainably sourced organic feedstocks — agricultural residues, landfill gas, wastewater biogas — convert waste streams into bankable baseload generation.
Agricultural residue (straw, husks), energy crops (miscanthus, SRC willow), landfill gas, municipal solid waste, wastewater sludge.
Feedstock is shredded, dried to optimal moisture content, or — for biogas — fed directly into anaerobic digestion vessels.
Direct combustion (steam-Rankine), gasification (syngas → GT), or anaerobic digestion (methane → gas engine or CHP).
Net electricity exported under a PPA or merchant route. Heat co-product (CHP) sold to industrial off-takers for additional revenue.
Biomass carbon accounting follows RED II / IPCC methodology. Waste-feedstock biogas projects can achieve carbon-negative certified status.
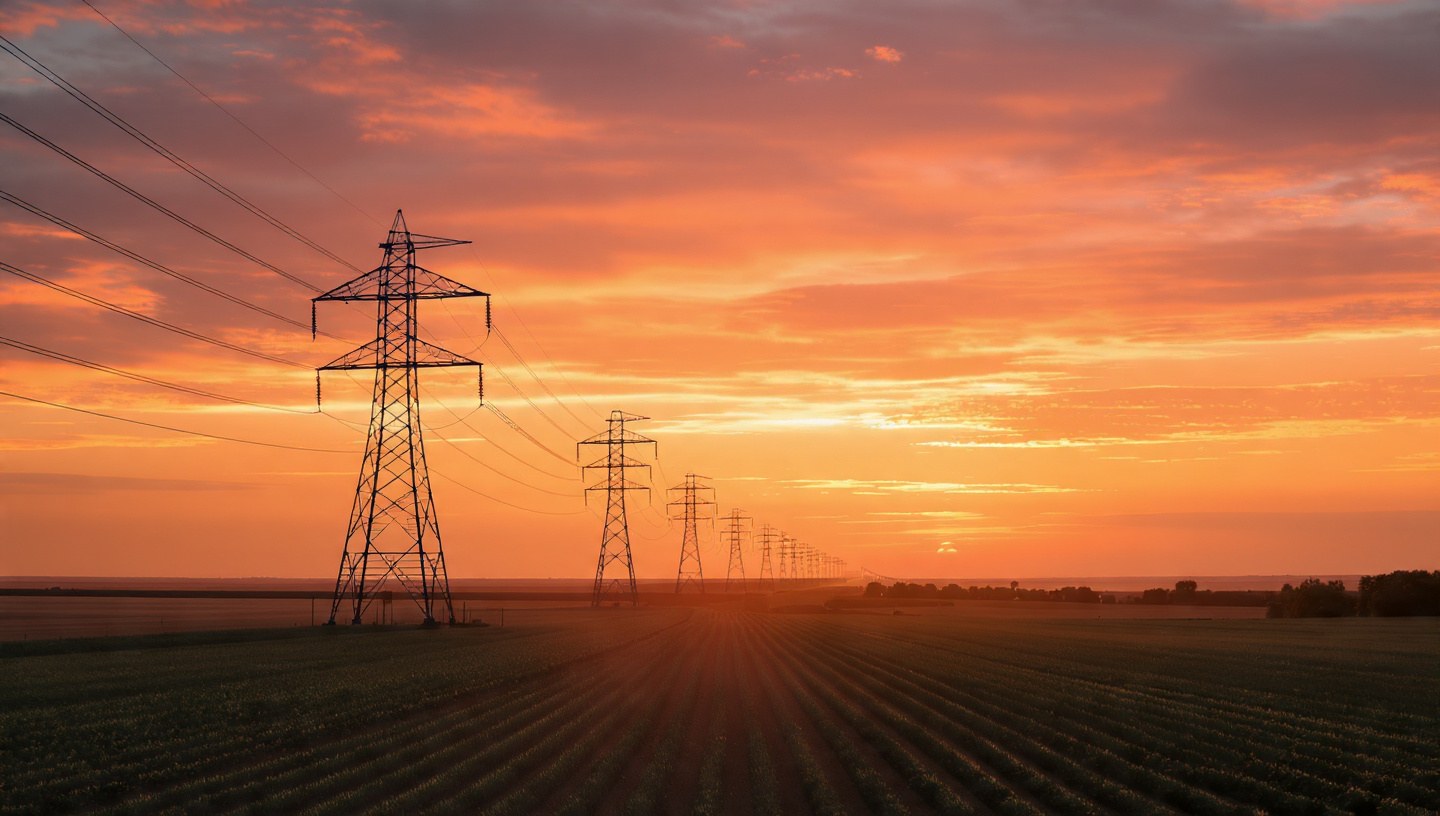
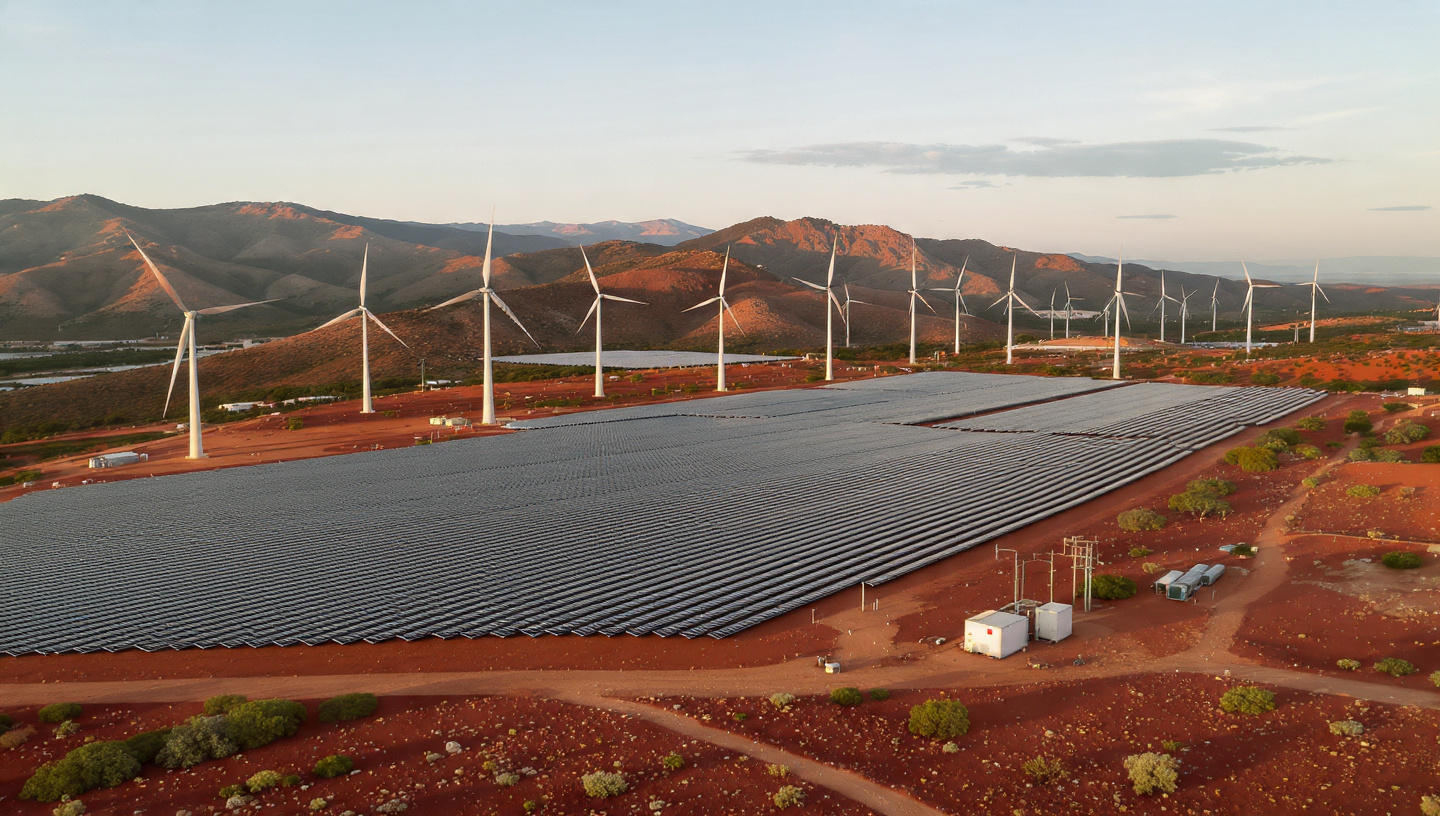
Energio increasingly co-locates complementary technologies on the same grid connection — Solar + BESS, Wind + BESS, and Solar + Wind hybrid arrays. Shared infrastructure reduces per-MW capex, maximises grid utilisation, and creates projects with near-continuous output.
Daytime solar generation charges the battery from curtailed excess. Battery dispatches stored energy into the evening peak, extending effective revenue hours by 4–6 hours daily.
Wind variability is smoothed by real-time battery buffer, meeting PPA delivery obligations even during rapid wind ramps. Frequency response revenue stacks on top.
Solar peak output (10:00–15:00) and wind peak output (night / shoulder) are naturally complementary on many sites, producing a combined capacity factor 15–25% higher than either alone.
Side-by-Side Overview
All figures are indicative portfolio averages. Individual project economics vary by geography, market, and contract structure.
| Technology | Capacity | Capacity Factor | PPA Term | Net Yield | Asset Life | Status |
|---|---|---|---|---|---|---|
|
|
||||||
| No technologies match the selected filter. | ||||||
¹ Yield figures represent unlevered net yields on stabilised operating assets before tax. Past performance of comparable assets is not a guarantee of future returns. Capital at risk.
Ready to Invest?
Energio blends solar, wind, storage, hydro, and biomass assets into a single investment vehicle — giving you diversified clean energy exposure backed by long-term contracted cash flows and real infrastructure.